

NATURE PERFORMANCE REPORTING
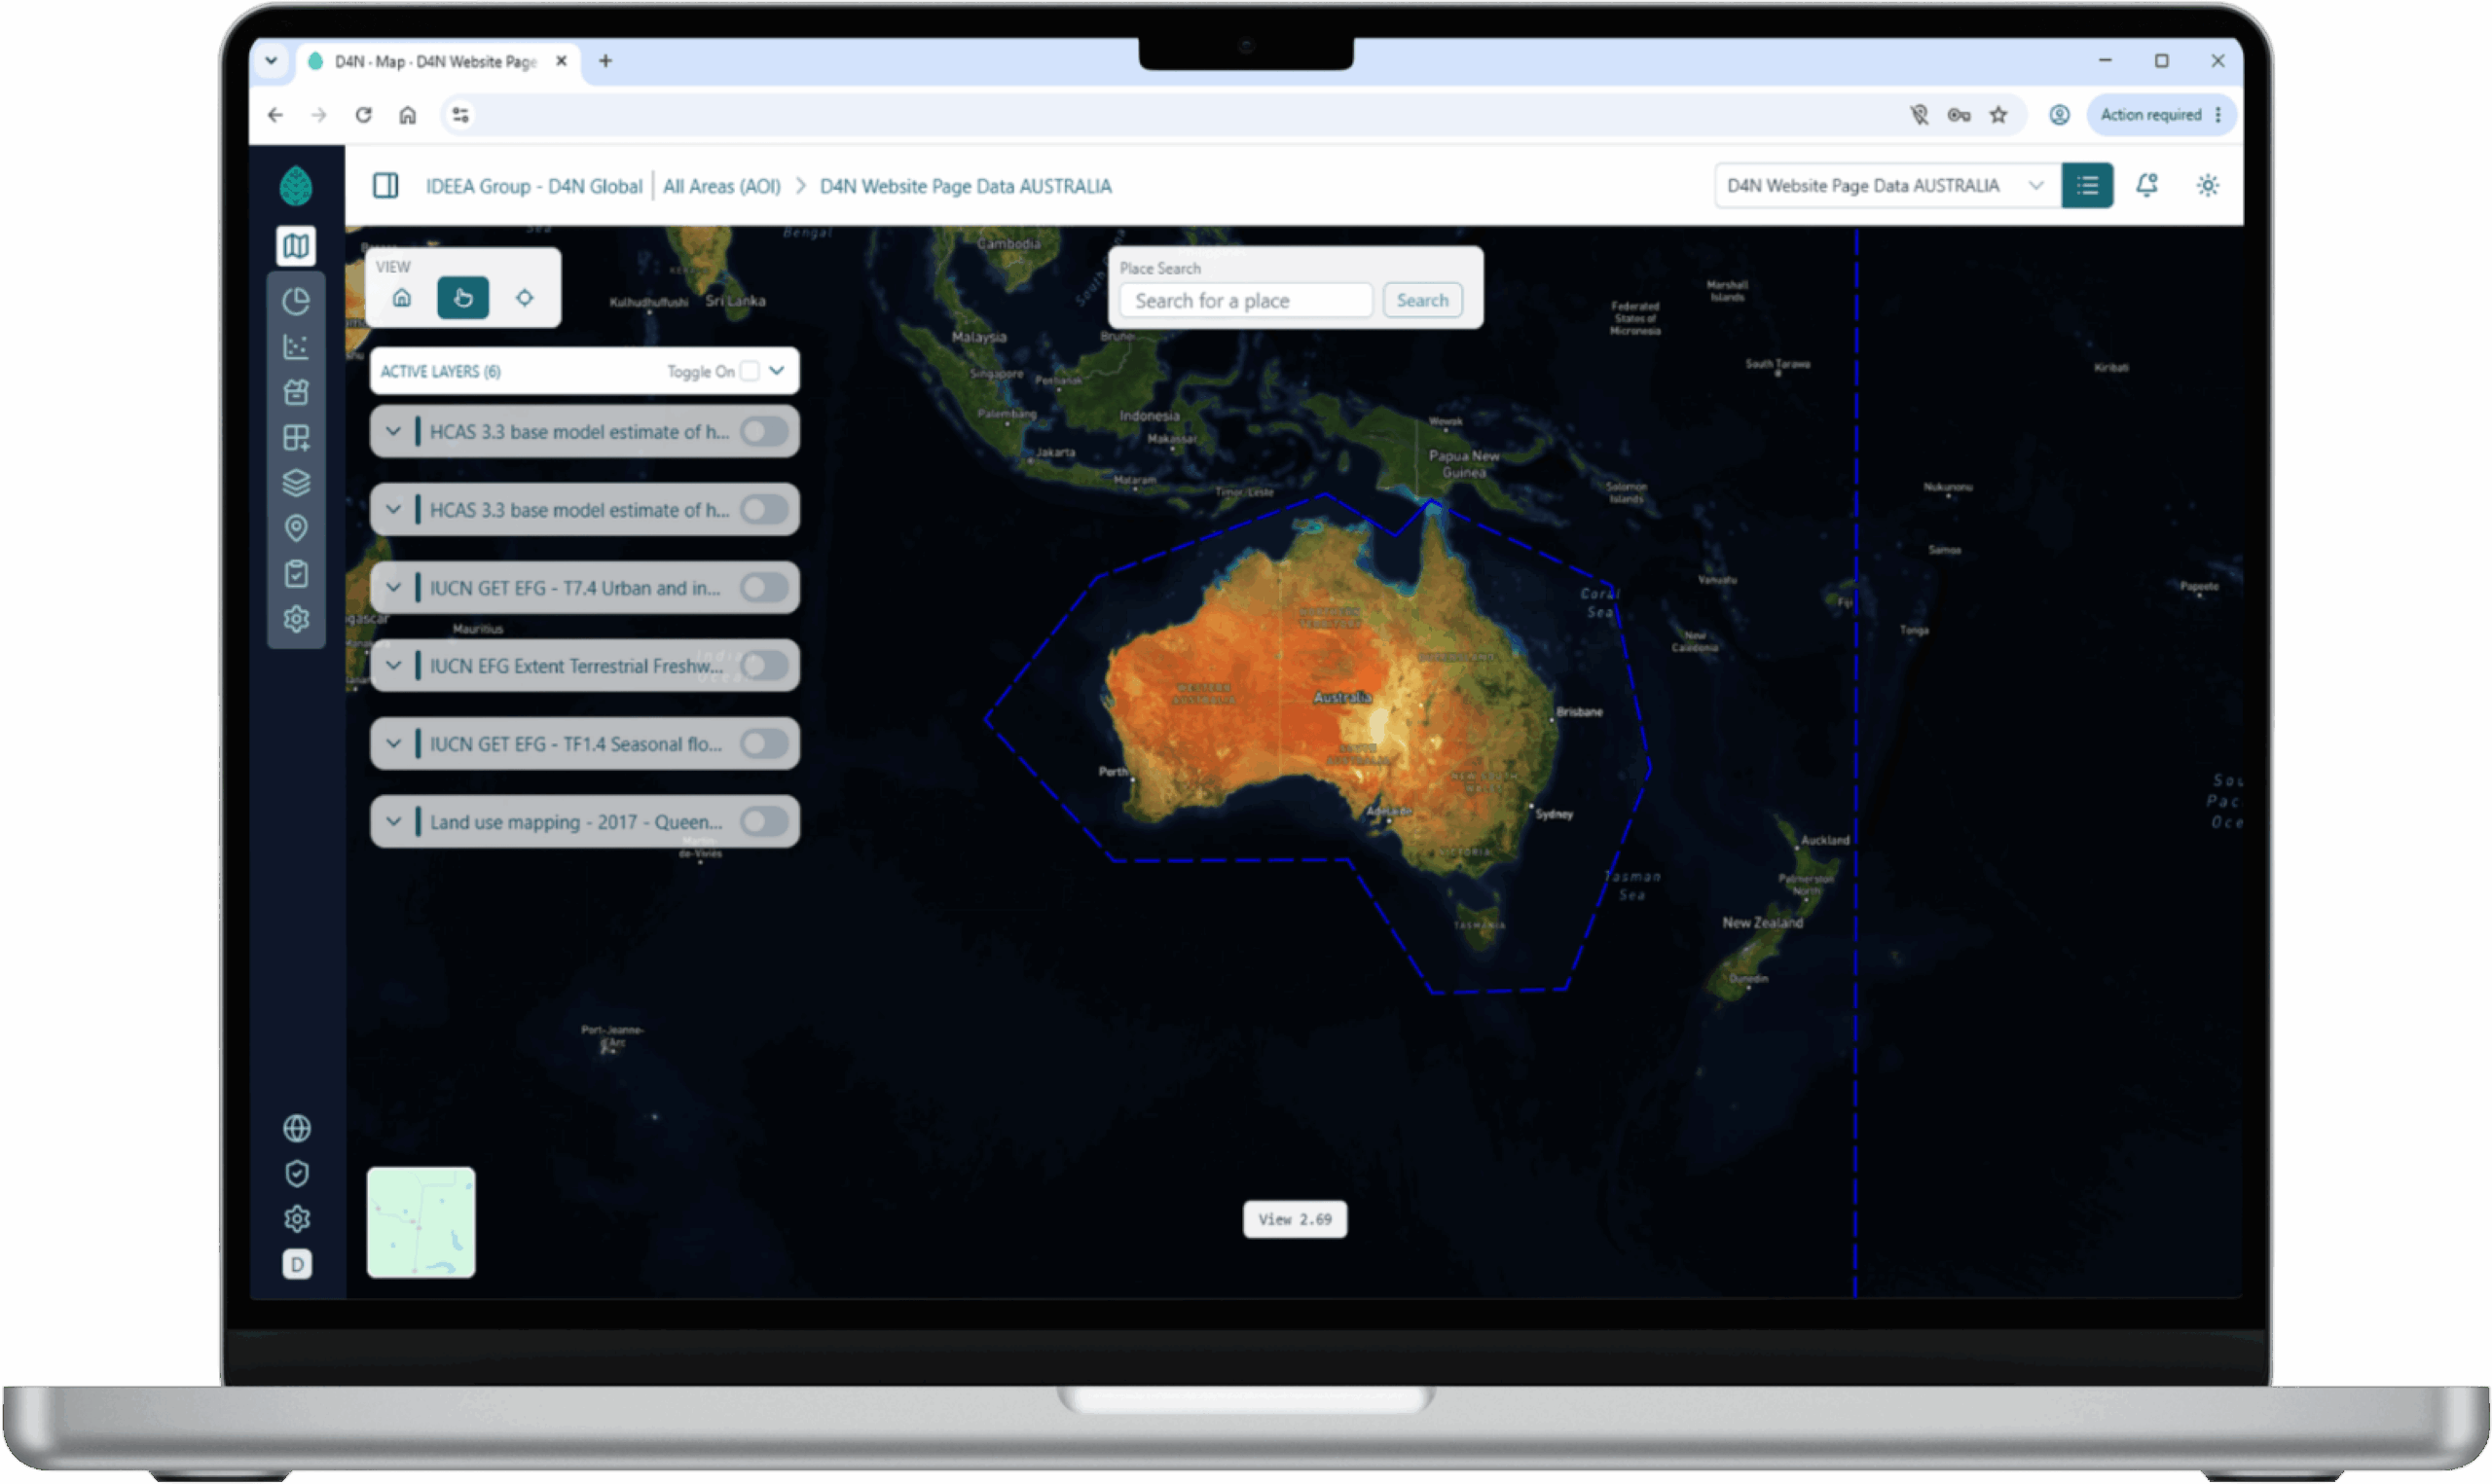
Track nature performance against your baseline and targets.
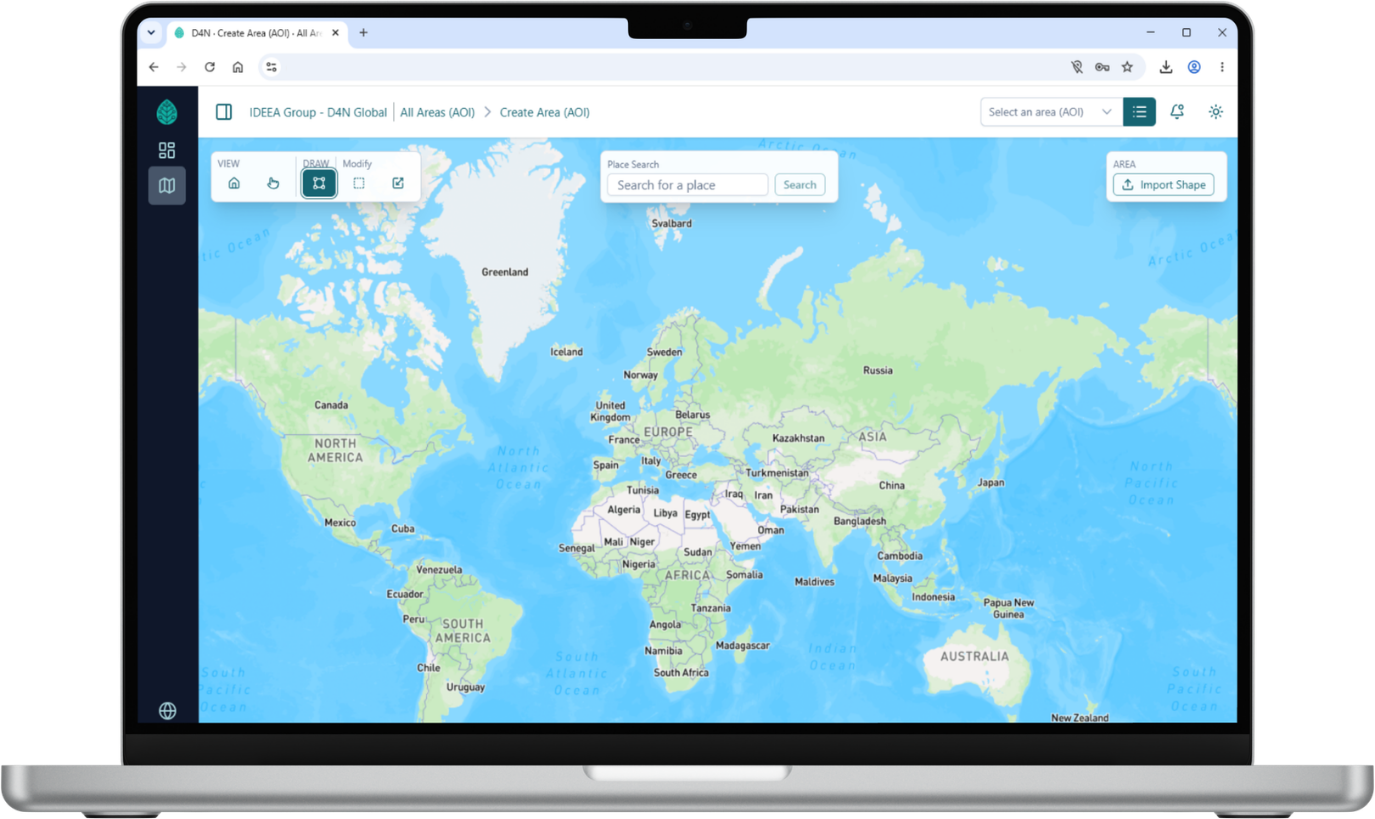
Turn your spatial accounts into custom dashboard reports that show what's changing across your sites, assets and landscapes and whether you're moving in the right direction.
THE OPPORTUNITY
MOVE FROM MEASURING NATURE TO TRACKING PERFORMANCE.
Knowing where nature is and what condition it's in is the starting point.
Performance reporting shows what happens next.
PERFORMANCE REPORTING
WHAT CAN YOU TRACK?

Nature Assets
Track changes in ecosystem area and land cover.

Condition
Monitor ecosystem condition against your baseline.

Trends
Monitor indicators over time to identify trends, patterns and changes overtime.
Targets
Measure progress against defined objectives & track key outcomes to ensure goals remain on target.

Performance
Understand whether interventions are improving nature outcomes.

Economic significance
Track how changes in nature relate to economic activity and what they mean financially.

REAL EXAMPLE
UNDERSTANDING CHANGE ACROSS A LANDSCAPE.
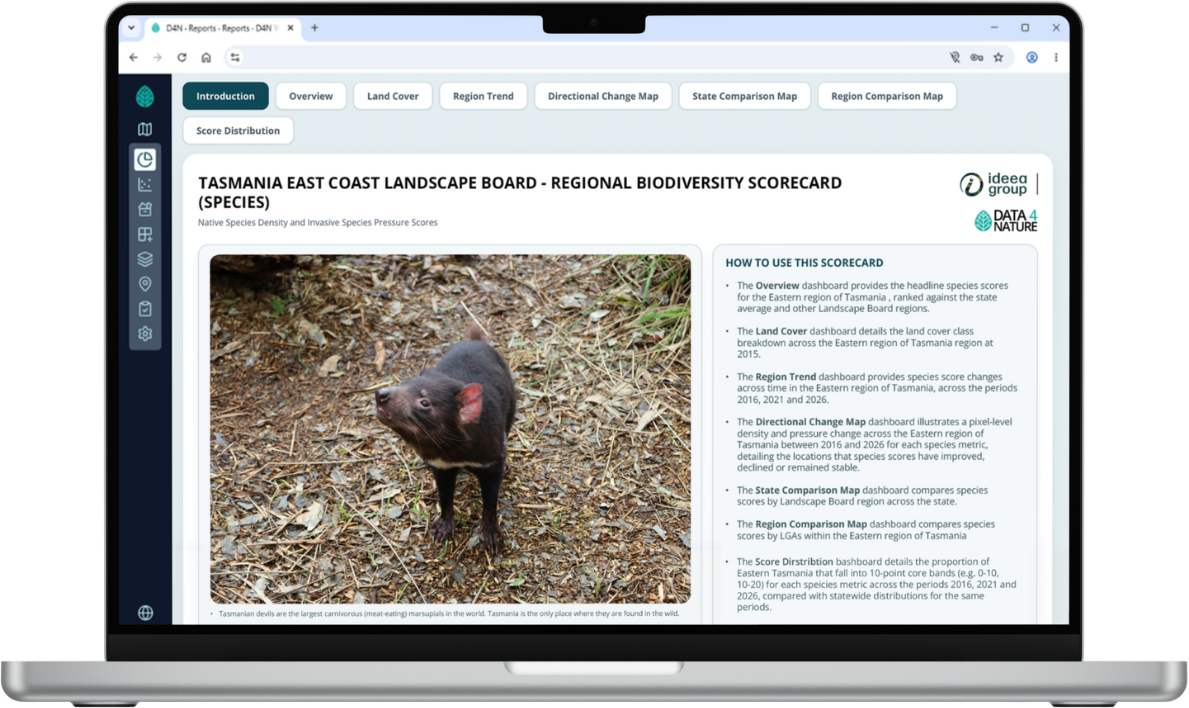
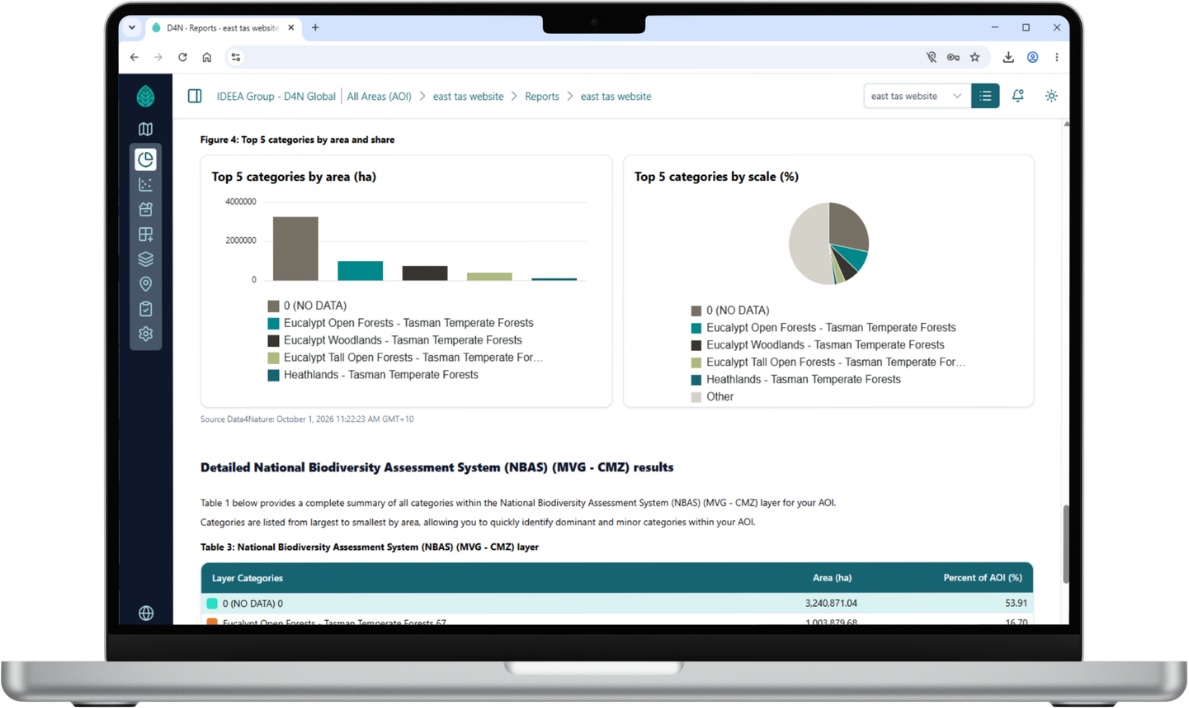
Tasmania East Coast Landscape Board — Regional Biodiversity Scorecard

Species density
See where biodiversity indicators are concentrated.

Land cover
Understand how ecosystem and land-use patterns vary.
Time series
Track how the landscape has changed across 2016, 2021 and 2026.
FROM BASELINE TO PERFORMANCE
KEEP THE SAME EVIDENCE WORKING OVER TIME.
Your baseline isn't a one-off assessment. The same spatial accounts can provide the evidence for ongoing monitoring and performance reporting.
Baseline
What was the starting condition?

Targets
What are you trying to achieve?

Monitoring
What's changing?

Performance
Are you moving towards the target?
Reporting
Can you demonstrate the outcome?
LEARN MORE ABOUT DATA4NATURE

WHAT IS DATA4NATURE?

NATURE MACRO-ANALYTICS

NATURE ASSET REPORTS
Know whether you're making progress.
Track change against your baseline and targets with a dashboard built around the information, indicators and questions that matter to you.
D4N draws on the same evidence base as Macro-Analytics and Asset Reports, so nothing here needs re-measuring from scratch.